Bitcoin Set to Skyrocket? Rare Patterns Indicate a Potential $166K Breakout!
Key Points:
- Bitcoin remains under pressure amid trade war concerns and Federal Reserve policies.
- Technical indicators suggest a major rebound, with a potential price target of $166,000.
- Fear grips the market, as the crypto fear and greed index drops to 35.
Bitcoin Faces Market Pressure but Signals Potential Rebound
Bitcoin’s price has struggled this week as global trade tensions and monetary policy concerns weigh on investor sentiment. The crypto fear and greed index has slipped to 35, reflecting growing uncertainty among traders. Meanwhile, Bitcoin’s price volatility continues as market participants stay on the sidelines.
Trade War Jitters Weigh on Bitcoin
The ongoing trade conflict between the United States and key economic partners has fueled market uncertainty. The U.S. has imposed tariffs on Chinese goods, affecting trade worth over $450 billion. While tariffs on Canadian and Mexican imports have been temporarily halted, there is speculation they could be reinstated next month. This turmoil has dampened investor confidence, leading to cautious trading in the cryptocurrency sector.
Federal Reserve’s Hawkish Stance Adds Pressure
Bitcoin’s struggles have also been influenced by the Federal Reserve’s latest monetary policy stance. The Fed maintained interest rates but hinted at only two rate cuts this year. Historically, Bitcoin and other cryptocurrencies have performed better under a more dovish Federal Reserve policy. Additionally, Spot Bitcoin ETF inflows have slowed, dropping from a yearly high of $68 billion to around $57 billion, indicating a temporary pullback in investor enthusiasm.
Also read: BNB Chain’s Test Token Soars to $35M Before Crashing: Traders Fuel Memecoin Madness
Technical Patterns Hint at a Potential Breakout
Despite current market headwinds, technical analysis suggests Bitcoin could be on the verge of a significant surge. Two rare chart patterns—the Cup and Handle (C&H) and the Bullish Flag—are forming, both of which historically precede major price breakouts.
Cup and Handle Pattern Suggests $123K Target
Bitcoin has been shaping a Cup and Handle pattern, which began forming in November 2021 and completed in late 2023. This classic bullish setup consists of a rounded bottom followed by a consolidation phase. Based on technical projections, the pattern suggests Bitcoin could surge to $123,000 over time.
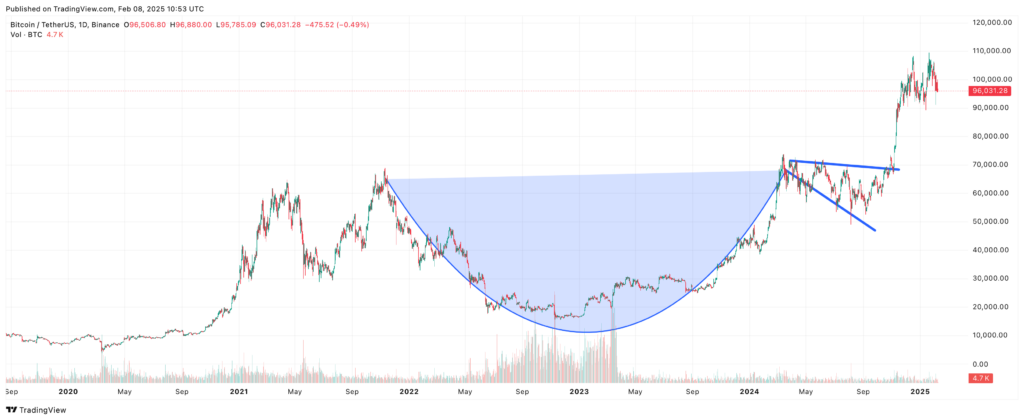
Bullish Flag Pattern Signals Potential for $166K
Bitcoin’s recent price consolidation aligns with a Bullish Flag pattern, which consists of a strong upward move followed by a rectangular consolidation. This setup typically results in an upward breakout. The projected price target based on this pattern is $166,000, representing a substantial upside from current levels.
Also read: XRP ETFs Move Closer to Approval: BlackRock Raises Stake in Strategy i
How Long Will It Take?
While these patterns are highly reliable, they operate on a weekly timeframe, meaning Bitcoin’s ascent to $166K could take months or even years. For example, the Cup and Handle pattern itself took nearly three years to form. Traders and investors should remain patient while closely monitoring price movements and macroeconomic factors.
Conclusion
Bitcoin’s current downturn has been driven by external economic pressures, including trade tensions and Federal Reserve policies. However, historical technical indicators suggest that a massive rally could be on the horizon. If these patterns play out as expected, Bitcoin could be poised for a record-breaking run toward $166,000—though it may take time for this bullish scenario to unfold. Investors should keep an eye on key support and resistance levels as they navigate the evolving crypto market.