Hedera Hashgraph’s price shows promising signs of a potential rally, driven by bullish chart patterns and favorable developments in the crypto market. Here are the key details:
Highlights:
- Bullish Pattern Emerges: Hedera’s daily chart reveals a symmetrical triangle pattern, hinting at a possible breakout.
- Market Catalysts: Anticipation of a spot ETF approval and rising Total Value Locked (TVL) fuel investor confidence.
- Key Levels to Watch: A breakout above $0.3920 could set the stage for a climb toward $0.50.
Recent Price Performance
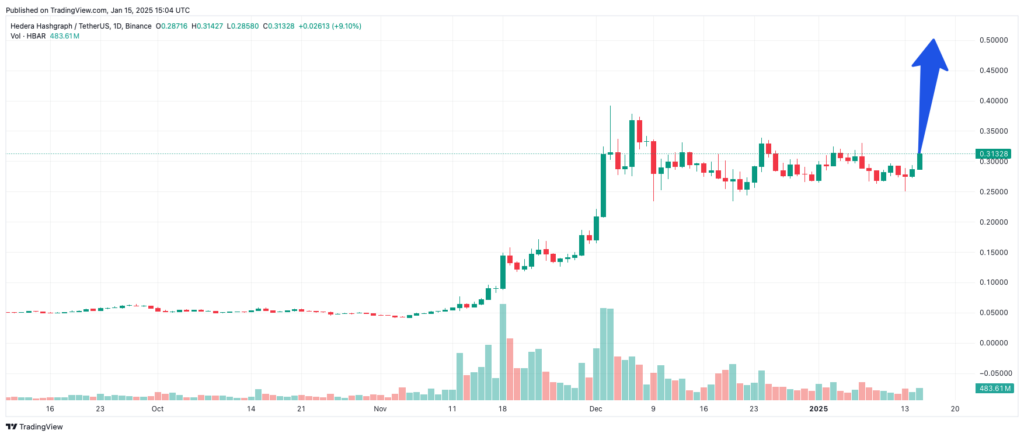
Hedera Hashgraph (HBAR) has stabilized after a strong rally, with prices reaching $0.3140, the highest level since January 7. The token is now 600% above its lowest point in 2024 and boasts a market capitalization exceeding $11.3 billion.
ETF Hopes Drive Optimism
The recent surge in HBAR’s value is attributed to investor optimism surrounding a potential spot exchange-traded fund (ETF) approval by the Securities and Exchange Commission (SEC). Emerging fund manager Canary has filed for an HBAR-focused ETF, and market analysts believe its chances of approval are strong.
In a recent report, JPMorgan suggested that the SEC, now under the leadership of Paul Atkins, is likely to greenlight crypto-focused funds. This move could unlock significant inflows for assets like Ripple (XRP), Solana (SOL), and potentially Hedera.
Strengthening Ecosystem
Hedera’s ecosystem continues to grow, with the total value locked (TVL) in its network climbing to $180 million. Leading protocols such as Stader, SaucerSwap, Bonzo Finance, and Heliswap contribute to this growth. Additionally, the stablecoin market cap within Hedera’s ecosystem has risen to $11 million.
Governed by a council of major corporations, including Tata, IBM, Dell, Worldpay, and Abrdn, Hedera is often regarded as a faster and more cost-effective alternative to Ethereum.
Technical Analysis
The daily chart paints a bullish picture for HBAR:
- Symmetrical Triangle Pattern: A common continuation signal, this pattern suggests a strong upward move could be on the horizon.
- Fibonacci Levels: HBAR is consolidating between the 61.8% and 78.6% retracement levels, signaling potential strength.
- Key Resistance Levels: The token is trading above its 50-day Exponential Moving Average and nearing the critical $0.3920 resistance point.

Outlook
If HBAR breaks above the $0.3920 level, it could trigger a rally toward the psychological target of $0.50, marking a potential 68% increase from its current price. This bullish breakout would confirm the pattern’s signal and could attract more investors to the asset.
With growing adoption, strong fundamentals, and favorable market conditions, Hedera Hashgraph’s price trajectory looks promising. Investors will closely monitor the $0.3920 level for signs of the anticipated breakout.


